


Ця щотижнева перевірка сайту не замінює повний SEO аудит, але добре працює як короткий робочий ритм. За 20 хвилин можна побачити, чи все в порядку зі скануванням, індексацією, швидкістю сайту, сигналами canonical і базовими технічними налаштуваннями.
Технічні проблеми рідко б’ють по трафіку без попередження. До просідання зазвичай уже видно сигнали в Search Console, індексації, robots.txt, sitemap.xml або в тому, як Google обходить сторінки.
Коротка щотижнева технічна оптимізація сайту корисна навіть для команд, у яких уже є налагоджені процеси. У практиці SEO-Evolution такий формат перевірки добре працює як ранній контроль після релізів, правок шаблонів, змін у CMS чи серверній частині.
Для комерційно важливих сайтів такий чекліст варто поєднувати не лише з регулярним просуванням сайту , а й з періодичним технічним аудитом сайту . Окремі перевірки в цьому матеріалі спираються на документацію Google та практику щотижневого моніторингу.
Чи достатньо 20 хвилин на тиждень?
Якщо говорити без прикрас, ні. За 20 хвилин не роблять повний технічний аудит, не розбирають складні конфлікти canonical, не тестують усі шаблони і не проходять увесь сайт вручну.
Це не глибоке дослідження, а короткий огляд, який допомагає швидко зрозуміти, чи все виглядає нормально, чи вже є сигнали, що потрібно копати далі.
В один тиждень такий огляд підтвердить, що сайт працює стабільно. В інший — допоможе вчасно побачити проблеми з noindex, rel canonical, mobile-first indexing, sitemap.xml або різке зростання технічних помилок у Search Console.
У цей формат не входить повна перевірка шаблонів, лог-файлів, JS-рендерингу, усіх зв’язків hreflang і canonical чи детальний аналіз причин падіння. Це короткий контрольний огляд, який допомагає зрозуміти, де потрібен глибший розбір.
Якщо ви давно не робили регулярний моніторинг, навіть така коротка перевірка сайту вже дасть користь. Вона не дозволяє дрібним технічним збоям непомітно накопичуватись.
1. Огляд Search Console (хвилини 0–10)
Найкраща точка старту — Google Search Console . Це перше місце, де видно, як Google реально бачить сайт: що індексує, що виключає, що сканує, а де вже є проблеми.
За ці 10 хвилин не потрібно намагатися зробити повний seo аудит. Завдання простіше: швидко відловити аномалії, які не схожі на звичайне тижневе коливання.
Почніть з Огляду
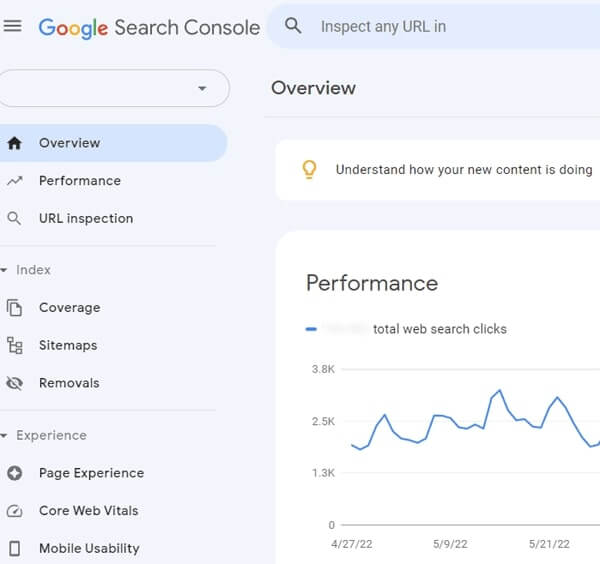
На цьому етапі дивіться на великі зміни, а не на дрібні рухи окремих запитів. Якщо є різке просідання кліків, показів або покриття, це вже привід не відкладати розбір.
- Перевірте, чи немає різкого падіння кліків та показів у продуктивності. Не кожне просідання означає технічну проблему, але різка зміна без очевидної причини — це сигнал.
- Зверніть увагу, чи не з’явилися нові збої в індексації після релізу, міграції, редизайну або правок шаблонів.
- Якщо сайт використовує мікророзмітку та structured data для товарів, статей, breadcrumbs, відео чи інших елементів, перегляньте також звіти rich results, коли вони доступні.
Якщо Search Console у вас ще не доведена до ладу, окремо перегляньте матеріал як правильно налаштувати Google Search Console .
Потім перейдіть до розділу індексації
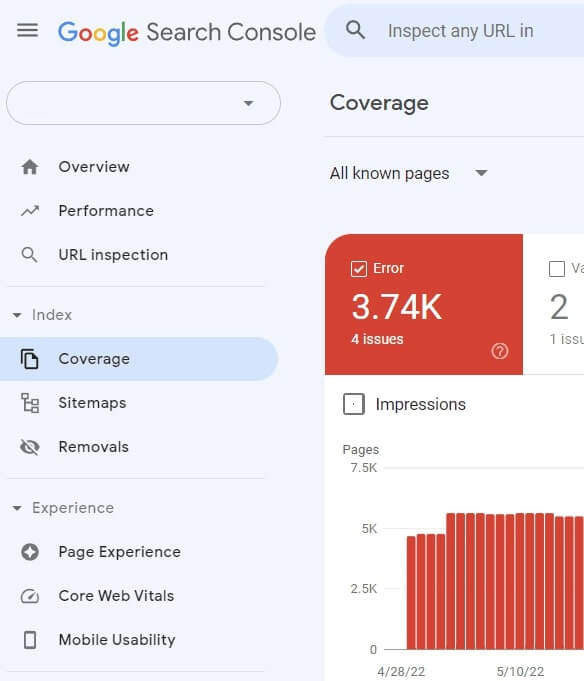
Далі відкрийте page indexing report — звіт про індексацію сторінок. Це один із найкорисніших звітів для щотижневої технічної перевірки, тому що саме тут видно, як Google поводиться з URL на рівні індексації.
Дивіться не лише на сам факт помилок, а й на їхню динаміку. Найбільше уваги зазвичай потребують такі причини:
- різке зростання сторінок з noindex;
- сторінки, заблоковані через robots txt, хоча вони мають бути в пошуку;
- сплеск soft 404 або інших нетипових виключень;
- конфлікти canonical, коли Google обирає не ту канонічну сторінку;
- збільшення групи дубльованих URL без чітко вибраного canonical.
Не кожен виключений URL — це помилка. Але якщо ви бачите нетипове зростання проблемних статусів, це вже не дрібна флуктуація, а привід розбиратися глибше. Логіку канонізації Google окремо пояснює в документації про canonical URL та rel canonical.
Перегляньте розділ Файли Sitemap
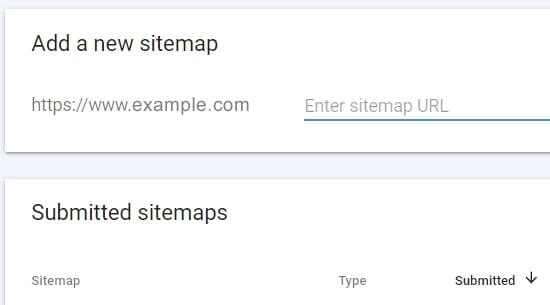
Тут важливо не просто переконатися, що sitemap xml додана. Перевірте, чи Google читав карту нещодавно, чи немає помилок обробки і чи відповідає структура sitemap актуальній архітектурі сайту.
Якщо у вас кілька карт для різних типів сторінок, це навіть краще: так легше помітити, де саме виникла проблема — у товарах, категоріях, статтях чи службових шаблонах.
Коли в sitemap є помилки, не ігноруйте їх на тій підставі, що сторінки ніби й так індексуються. Карта сайту — це базовий сигнал для Google, і якщо він забруднений, це ускладнює діагностику надалі.
Перевірка ручних дій і вибіркова URL-перевірка
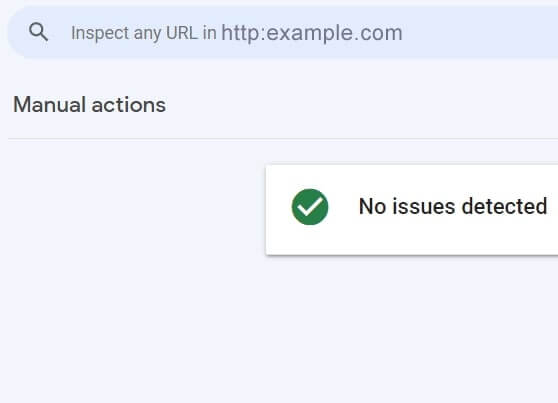
Manual Actions — той звіт, який хочеться бачити порожнім завжди. Але саме тому його і треба відкривати регулярно. Краще дізнатися про проблему з Search Console, ніж із раптового обвалу видимості.
Наприкінці цього блоку відкрийте URL Inspection Google для 1–2 критично важливих сторінок: головної, ключової категорії, послуги або сторінки, яка дає заявки. Подивіться, чи URL індексується, коли востаннє сканувалась, який canonical обрав Google і чи не суперечить він вашому rel canonical.
Якщо підозрюєте проблему зі скануванням, додатково загляньте в Crawl Stats Report у налаштуваннях Search Console. Він корисний, коли треба швидко перевірити, чи не просіли запити Googlebot, чи не підросла середня відповідь сервера і чи немає сплесків 5xx-помилок після змін на сайті.
2. Перевірте robots.txt (хвилини 11–12)
Файл robots.txt — один із найпростіших технічних елементів, але саме він регулярно стає причиною неприємних історій після релізів, міграцій або робіт на staging-середовищі.
Тут важливо пам’ятати головне: robots txt керує скануванням, але не гарантує виключення сторінки з індексу. Якщо сторінку потрібно не показувати в пошуку, для цього зазвичай потрібні noindex, правильні статус-коди або обмеження доступу, а не лише блокування через robots.txt.
Щотижнева перевірка займає хвилину-дві:
- відкрийте файл на живому сайті і переконайтеся, що він віддається коректно;
- перевірте, чи не з’явилась випадкова директива на кшталт Disallow: /;
- подивіться, чи не заблоковані важливі каталоги, CSS, JS або службові ресурси, потрібні для рендерингу;
- переконайтеся, що шлях до sitemap актуальний.
Особливо уважно дивіться на robots.txt після оновлень CMS, доробок шаблонів, перенесення сайту або робіт, які виконувались ще на етапі розробки сайту .
Якщо хочете окремо освіжити логіку цього файлу, перегляньте матеріал robots.txt: що це і навіщо він потрібен .
User-agent: *
Disallow: /
Такої директиви на живому сайті бути не повинно, якщо ви не блокуєте весь ресурс свідомо.
3. Перевірте швидкість сайту та Core Web Vitals (хвилини 13–15)
У цьому блоці не потрібно робити повний профайлінг фронтенду. Завдання простіше — зрозуміти, чи не стало сайту гірше за останній тиждень і чи немає очевидного просідання в page experience Google.
Core Web Vitals — це набір метрик реального користувацького досвіду. Для щотижневого контролю достатньо швидко звіряти загальний тренд, а якщо бачите погіршення — уже точково запускати PageSpeed Insights або Lighthouse для потрібних URL.
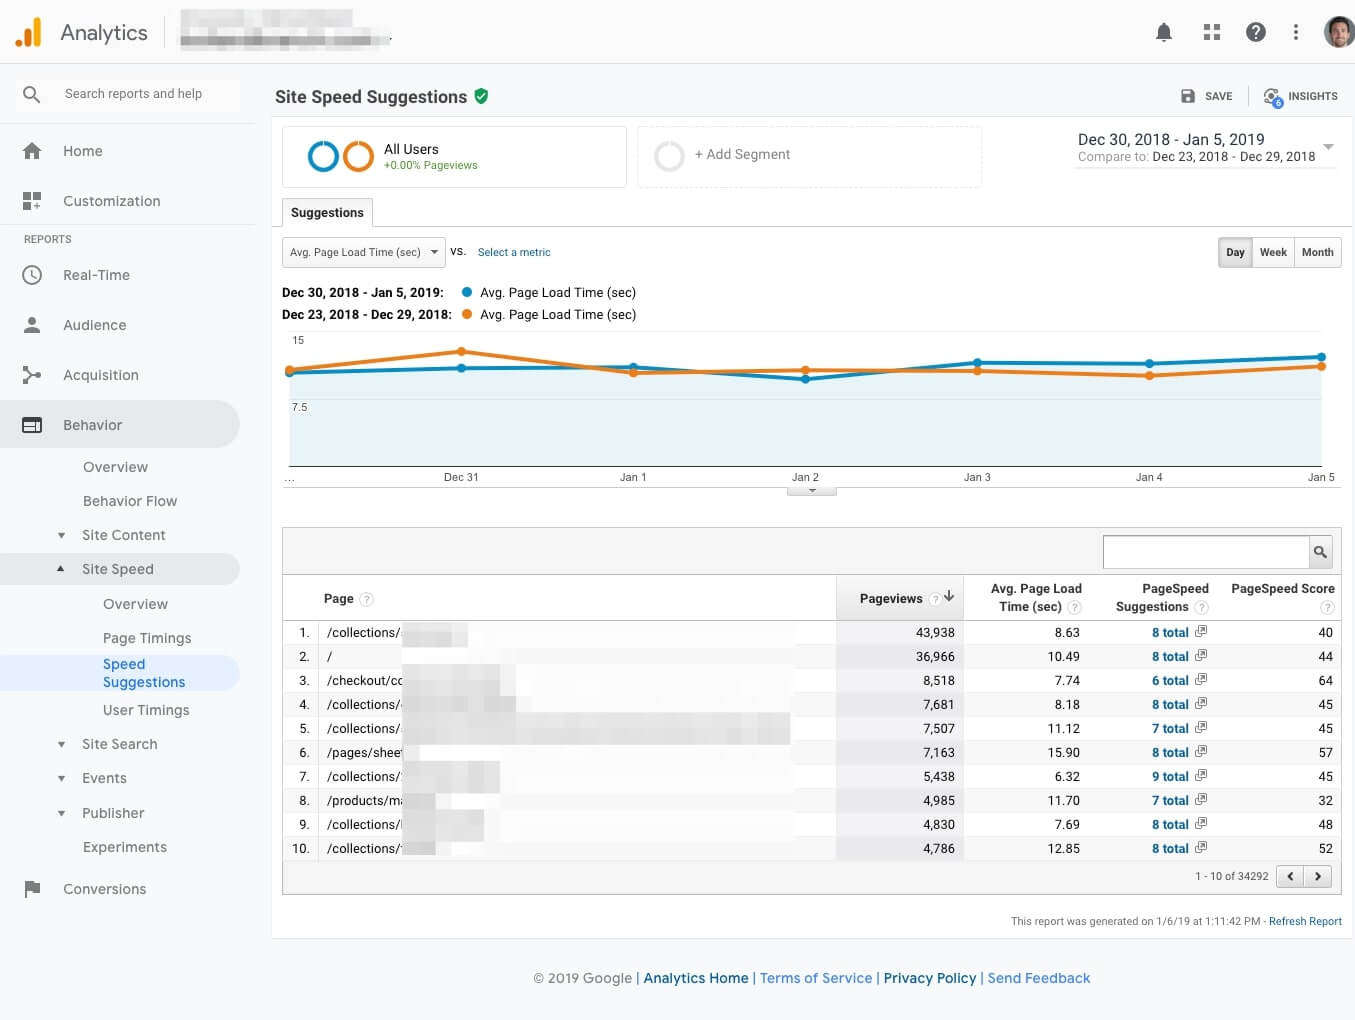
Скрін нижче ілюструє сам принцип швидкої перевірки: спочатку дивитеся загальну динаміку, потім — шаблони сторінок, де просідання найпомітніше. Для SEO-оцінки орієнтуватися варто насамперед на Core Web Vitals і PageSpeed Insights .
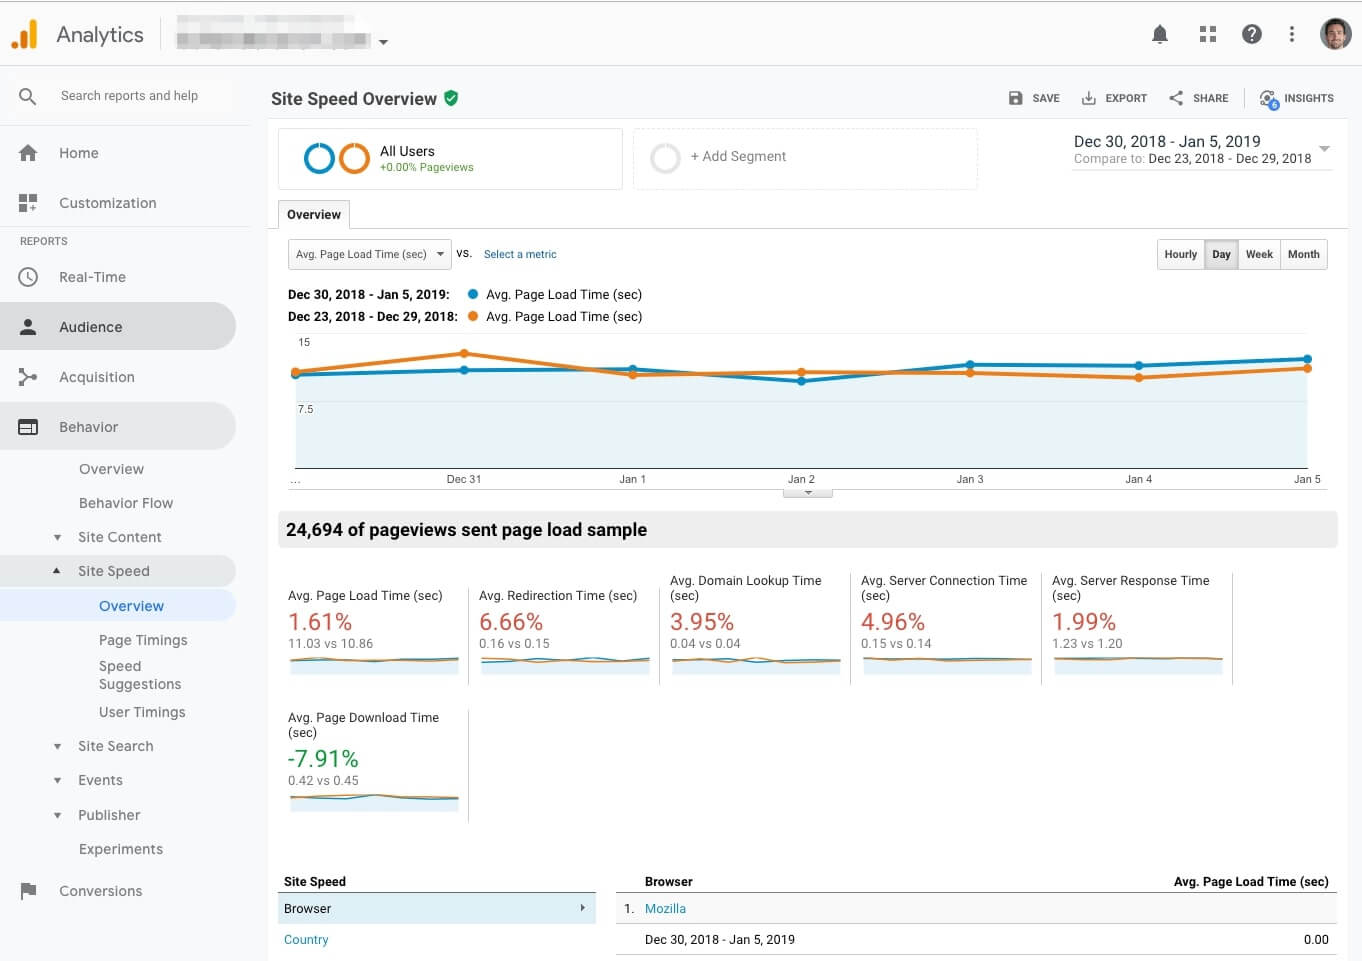
Якщо у вас є внутрішній дашборд у GA4 або Looker Studio, зручно порівнювати останній тиждень із попереднім. Але для SEO-оцінки не варто спиратися лише на загальний звіт швидкості: дивіться на шаблони, мобільні сторінки та реальні URL, які дають трафік і заявки.
У першу чергу перевіряйте мобільну версію сторінок, тому що mobile-first indexing означає: для індексації та ранжування Google насамперед спирається на мобільний контент. Якщо головна, категорії чи ключові посадкові сторінки різко просіли на мобайлі, це важливіше за косметичні дрібниці на desktop.
Що перевіряти швидко:
- чи не зросла середня швидкість сайту після релізу;
- чи не погіршились шаблони з комерційним трафіком;
- чи не з’явилися великі відхилення в LCP, INP і CLS;
- чи немає нових важких скриптів, банерів, віджетів або медіа, які ламають стабільність верстки.
Якщо бачите просідання, проганяйте 2–3 ключові URL через PageSpeed Insights і Lighthouse, а не намагайтеся пояснити все лише загальною цифрою.
4. Перегляньте результати пошуку (хвилини 15–18)
Жоден інструмент не замінить живий перегляд SERP. Навіть якщо у вас є трекери позицій, раз на тиждень варто власноруч подивитися, що реально бачить користувач у видачі.
Перевіряйте не десятки фраз, а кілька найважливіших запитів: бренд, основні комерційні сторінки, ключові інформаційні запити й одну-дві критичні посадкові сторінки.

На що дивитися:
- чи ранжується правильна сторінка, а не дубль або другорядний URL;
- чи не зламався title, description або favicon;
- чи не потрапила в SERP сторінка, яка мала бути закрита через noindex або canonical;
- чи коректно працює hreflang на мультимовному сайті, якщо у вас є кілька мовних версій;
- чи не зникли rich results там, де у вас реалізована мікророзмітка.
Якщо у видачі з’являється не та сторінка, яку ви просували, дуже часто проблема не в контенті, а в сигналах canonical. У контексті rel canonical SEO-помилка зазвичай виникає тоді, коли тег суперечить sitemap, внутрішнім посиланням, hreflang або фактичній структурі шаблонів.
Для мультимовних сайтів корисно час від часу звіряти і hreflang , особливо після запуску нових мовних версій або змін у шаблонах. А якщо є підозра, що rich results зникли через розмітку, перевірте відповідні сторінки через документацію Google про structured data та Rich Results Test . Це швидкий спосіб зрозуміти, чи Google взагалі бачить вашу мікророзмітку і чи не з’явились технічні помилки після змін у шаблоні.
5. Візуально перевірте сайт (хвилини 19–20)
Фінальні дві хвилини варто витратити на дуже просту, але корисну дію: відкрити сайт очима людини, а не звіту. Саме так часто знаходять проблеми, які ще не встигли відбитися в інструментах.
Починайте з мобільної версії, а потім коротко дивіться desktop. Через mobile-first indexing саме мобільний рендер має першочергове значення для пошуку.
Швидко пройдіться по головній, ключовій категорії, сторінці послуги й одній-двох статтях блогу. Вас цікавлять не дрібні стилістичні нюанси, а речі, які можуть реально вплинути на індексацію або конверсію:
- зламані блоки, порожні секції, биті зображення, недовантажений JS;
- неочікувані банери, попапи або елементи, що перекривають контент;
- проблеми з меню, пагінацією, фільтрами, крихтами та внутрішньою перелінковкою;
- випадковий noindex у коді;
- неправильний rel canonical;
- зайвий або поламаний hreflang;
- відсутня або зламана мікророзмітка у вихідному коді.
Після цього відкрийте вихідний код однієї-двох сторінок і перевірте базові сигнали: title, meta robots, rel canonical, hreflang, JSON-LD або іншу мікророзмітку. Це проста дія, але вона часто допомагає помітити те, що не видно при поверхневому перегляді шаблону.
Інструменти розробника > Перегляд вихідного коду сторінки
Висновок
20-хвилинна щотижнева перевірка сайту не замінює повноцінний аудит. Її задача практична: рано помічати проблеми зі скануванням, індексацією, швидкістю сайту, canonical, hreflang, sitemap.xml і базовими технічними сигналами до того, як вони вдарять по трафіку.
Якщо за цим коротким оглядом видно аномалії, не відкладайте розбір. У цей момент простий щотижневий ритуал уже переходить у повноцінний SEO-аудит сайту або окремий технічний аудит .
Якщо сайт розвивається, отримує нові розділи, мовні версії, шаблони та інтеграції, регулярна технічна оптимізація сайту має бути не разовою задачею, а постійним процесом. Саме так технічний моніторинг зазвичай і вибудовується в проєктах, які супроводжує SEO-Evolution.