


Google Search Console показує, як сайт представлений у пошуку Google: за якими запитами з’являються сторінки, скільки вони отримують показів і кліків, які URL-адреси проіндексовані та які технічні проблеми заважають Google сканувати контент.
Це безкоштовний сервіс для власників сайтів, SEO-фахівців, маркетологів і розробників. До 2015 року сервіс називався Google Webmaster Tools, тому в українськомовному середовищі ще трапляються назви гугл вебмайстер та інструменти для вебмайстрів Google. Серч консоль — неофіційна передача сучасної англійської назви.
За даними Search Console можна визначити, де сайт втрачає покази, кліки або сторінки з індексу, перевірити причину й сформувати конкретний список змін.
У SEO-Evolution ми аналізуємо дані GSC разом із Google Analytics 4, технічним скануванням, пошуковою видачею та історією змін на сайті. Так можна відрізнити падіння попиту від технічної помилки, слабкого сніпета, втрати позицій або проблеми з індексацією.
Що таке Google Search Console?
Google Search Console – це інструмент Google для контролю органічного пошукового трафіку, індексації та технічного стану сайту. Він показує дані, які Google збирає під час сканування, обробки й показу сторінок у пошуку.
За допомогою Search Console можна:
- переглядати кліки, покази, CTR і середню позицію;
- знаходити пошукові запити та сторінки, на які переходять користувачі;
- перевіряти індексацію конкретної URL-адреси;
- аналізувати причини виключення сторінок з індексу;
- додавати XML-карту сайту;
- контролювати Основні веб-показники, HTTPS і структуровані дані;
- перевіряти заходи, вжиті вручну, і проблеми з безпекою;
- переглядати частину зовнішніх і внутрішніх посилань;
- оцінювати наслідки міграції, редизайну або зміни CMS.
Підключення Search Console не є умовою появи сайту в Google. Пошукова система може знайти сторінки через зовнішні й внутрішні посилання. GSC дає власнику інструменти для перевірки того, як Google сканує та індексує сайт.
Search Console підключається до вебсайту, а не до картки компанії в Google. Для адреси, графіка роботи, телефону, відгуків і присутності в Google Maps використовуйте Google Business Profile.
Реєстрацію й оптимізацію картки компанії ми докладно розібрали в матеріалі Google Business Profile у 2026 році .
Як увійти та додати сайт у Google Search Console
Для початку роботи потрібно увійти через обліковий запис Google, створити ресурс сайту та підтвердити право власності. Тип ресурсу визначає, які протоколи, піддомени й каталоги потраплять до звітів.
Як увійти в Google Search Console
Окремий обліковий запис Search Console створювати не потрібно. Сервіс використовує звичайний обліковий запис Google.
- Відкрийте Google Search Console .
- Увійдіть через потрібний обліковий запис Google.
- Виберіть наявний ресурс або натисніть кнопку додавання нового.
- Якщо ресурс уже створив інший користувач, попросіть його надати вам доступ.
Якщо після входу потрібного сайту немає у списку, перевірте адресу облікового запису. Не створюйте ще один ресурс, доки не уточните, хто з власників або попередніх підрядників має доступ до наявного.
Який тип ресурсу обрати
Search Console пропонує два основні варіанти: доменний ресурс і ресурс із префіксом URL-адреси. Для повного контролю сайту зазвичай використовують доменний ресурс.
| Параметр | Доменний ресурс | Префікс URL-адреси |
|---|---|---|
| Приклад | example.com |
https://www.example.com/blog/ |
| Протоколи | Охоплює HTTP і HTTPS | Охоплює лише вказаний протокол |
| Піддомени | Охоплює www, shop, blog та інші піддомени | Охоплює лише вказаний піддомен |
| Окремий каталог | Не обмежується шляхом | Може охоплювати окремий каталог або мовну версію |
| Підтвердження | Через DNS-запис | Через DNS, HTML-файл, метатег, Google Analytics або Google Tag Manager |
| Коли використовувати | Для контролю всього домену | Для окремої версії, піддомену або розділу |
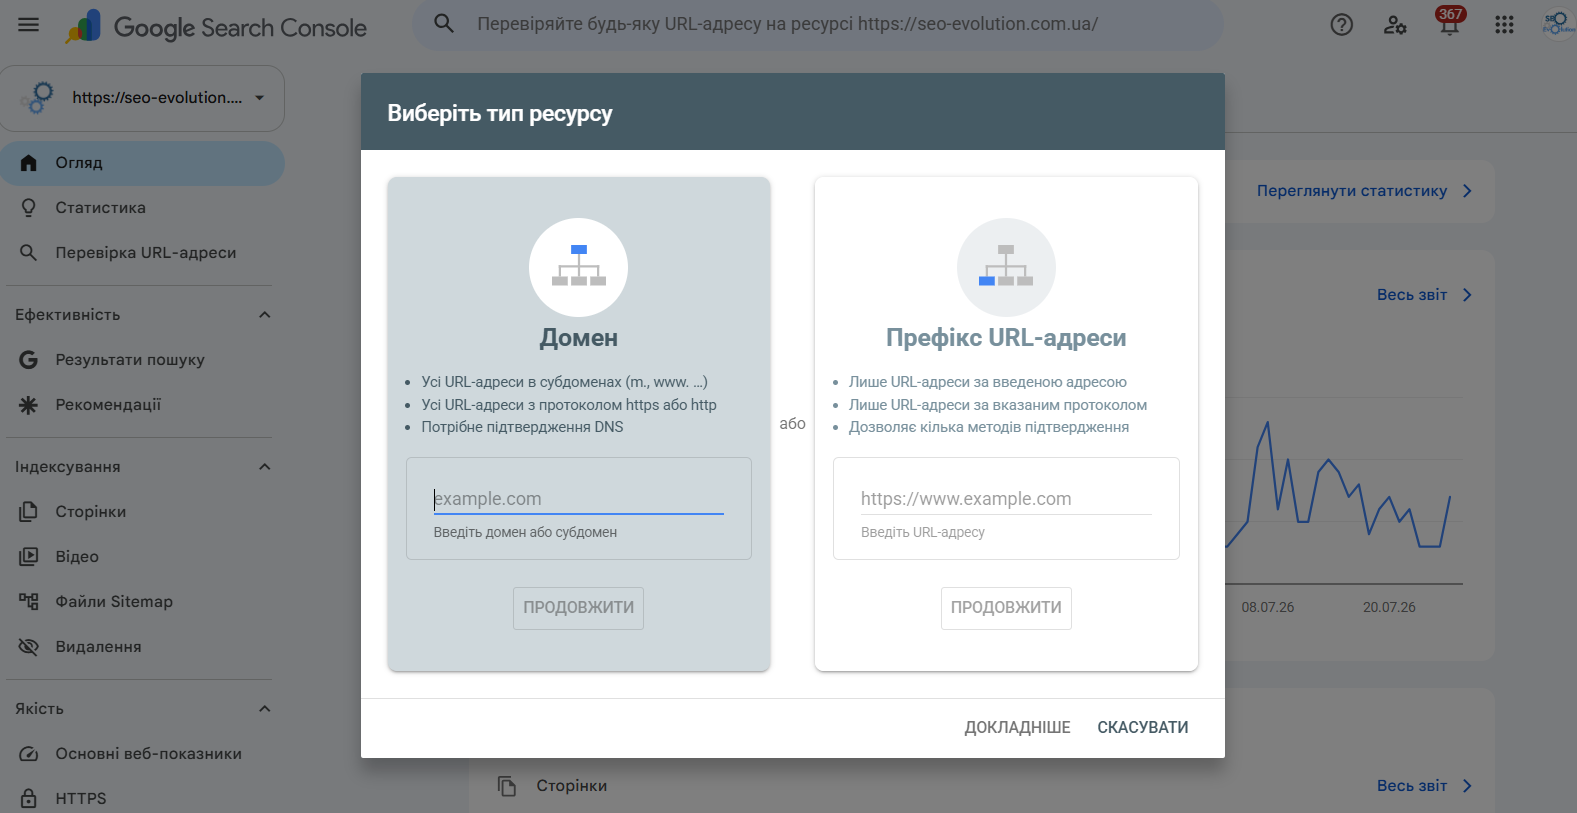
Доменний ресурс об’єднує дані всіх протоколів і піддоменів. Ресурс із префіксом URL-адреси створюйте додатково, коли потрібно окремо аналізувати блог, мовну версію, піддомен або інший розділ.
Як підтвердити право власності на сайт
Підтвердження права власності показує Google, що користувач має доступ до домену або коду сайту. Спосіб підтвердження залежить від типу ресурсу й доступів.
- DNS-запис. Використовується для доменного ресурсу й підходить для ресурсу з префіксом URL-адреси.
- HTML-файл. Завантажується в кореневий каталог сайту.
- HTML-метатег. Додається в секцію
<head>головної сторінки. - Google Analytics. Працює за наявності потрібних прав і коректно встановленого коду.
- Google Tag Manager. Потребує правильно встановленого контейнера й відповідного рівня доступу.
Після успішного підтвердження залиште DNS-запис, HTML-файл або метатег на місці. Google періодично перевіряє токен повторно. Після його видалення власник може втратити підтверджений статус.
Як розподілити права доступу
Основним власником ресурсу має залишатися представник компанії. SEO-фахівцю, агентству, аналітику або розробнику надайте окремий доступ відповідно до їхніх задач.
- Власник. Керує ресурсом, користувачами, налаштуваннями й усіма інструментами.
- Користувач із повним доступом. Переглядає всі дані й виконує доступні для користувача дії.
- Користувач з обмеженим доступом. Переглядає більшість звітів без адміністративних прав.
Після зміни працівників або підрядників перегляньте список користувачів і видаліть доступи, які більше не потрібні.
Як налаштувати Google Search Console
Після додавання ресурсу подайте карту сайту, розподіліть доступи й перевірте індексацію основних типів сторінок. Після появи даних можна переходити до аналізу пошукових запитів і технічних звітів.
- Перевірте охоплення ресурсу. Переконайтеся, що в нього входять потрібні протоколи, піддомени й мовні версії.
- Додайте sitemap.xml. У карті мають бути канонічні сторінки, які повертають код 200.
- Додайте користувачів. Надайте доступ SEO-фахівцю, розробнику, аналітику або іншому працівнику, якому потрібні дані GSC.
- Перегляньте розділ Індексування → Сторінки. Перевірте, чи Google знаходить основні типи сторінок.
- Відкрийте розділ Безпека й заходи, вжиті вручну. Переконайтеся, що Google не повідомляє про критичні проблеми.
- Зв’яжіть ресурс із Google Analytics 4. Це дозволить аналізувати пошукові показники та поведінку на посадкових сторінках в одному середовищі.
Для нового або щойно доданого сайту формування перших даних може тривати до тижня. Коли звіти стануть доступні, Google може надіслати повідомлення на електронну пошту власника. Якщо через тиждень даних немає, перевірте протокол, домен і наявність показів сайту в пошуку.
На сторінці Огляд також можуть з’являтися рекомендації Google щодо проблем, можливостей або налаштувань. Перевірте, до яких URL вони належать і чи відповідає запропонована дія структурі вашого сайту.
Основні звіти Google Search Console
Кожен розділ Search Console відповідає на окреме питання: як сайт отримує трафік, чому сторінка не індексується, чи може Googlebot її відкрити, які URL мають проблеми зі швидкодією та чи зафіксовані порушення безпеки.
Меню різних ресурсів може відрізнятися. Додаткові звіти з’являються, коли Google знаходить на сайті відповідний тип контенту, структуровану розмітку або покази в окремому сервісі, наприклад Discover.
| Що потрібно перевірити | Де знайти звіт |
|---|---|
| Пошукові запити, кліки, покази, CTR і позиції | Ефективність |
| Стан конкретної сторінки в Google | Перевірка URL-адреси |
| Масові проблеми індексації | Індексування → Сторінки |
| Обробка XML-карти сайту | Індексування → Файли Sitemap |
| Реальні показники швидкодії | Якість → Основні веб-показники |
| Ручні санкції Google | Безпека й заходи, вжиті вручну → Заходи, вжиті вручну |
| Злам, фішинг або шкідливе ПЗ | Безпека й заходи, вжиті вручну → Проблеми з безпекою |
| Зовнішні та внутрішні посилання | Посилання |
| Сторінки й запити зі зростанням або падінням | Статистика |
| Активність Googlebot і відповіді сервера | Налаштування → Статистика сканування |
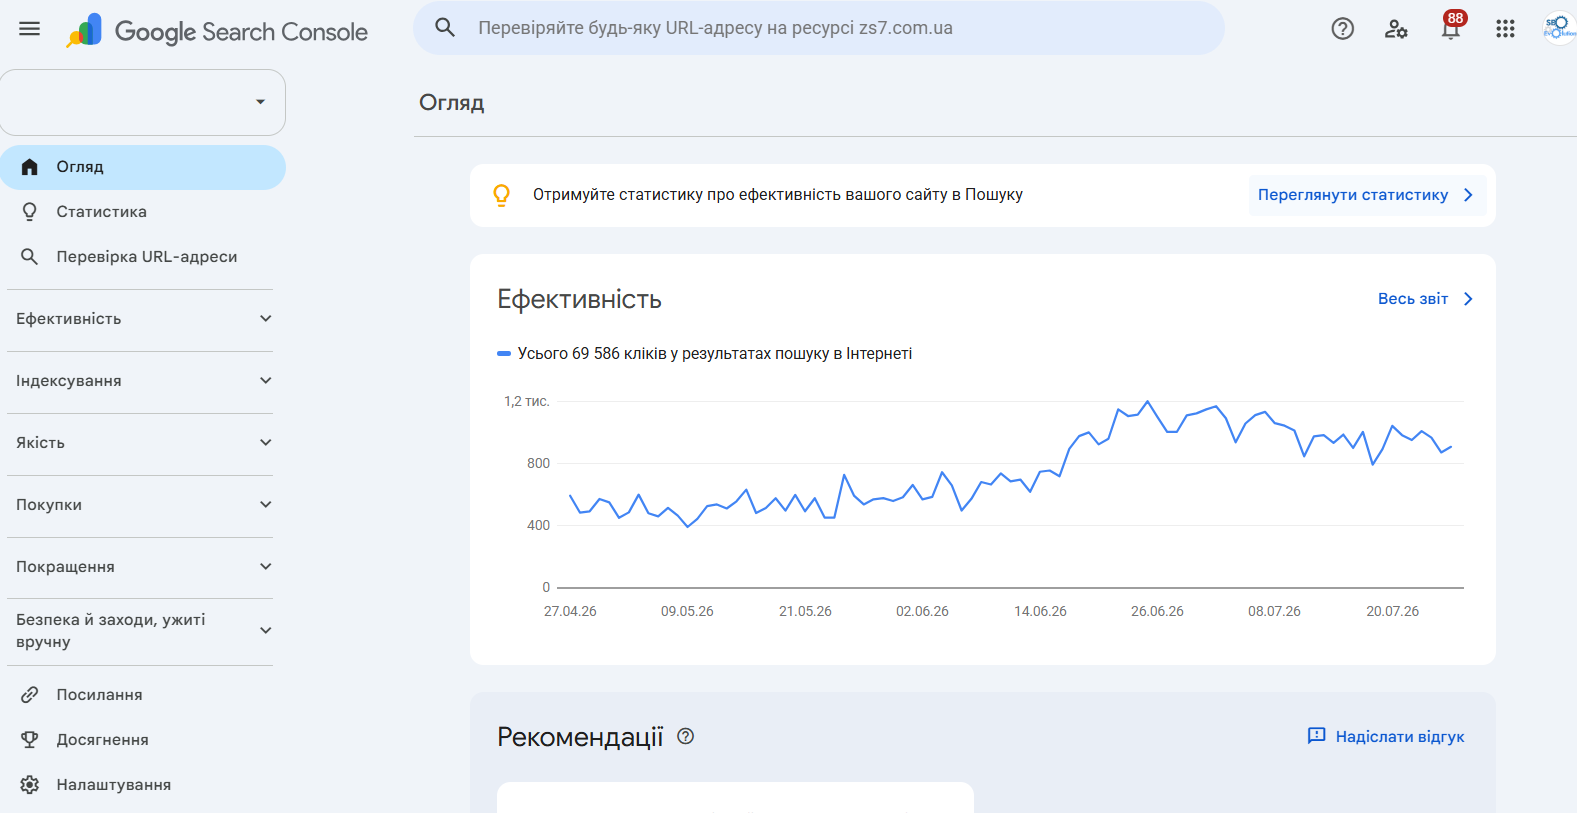
Звіт Ефективність у Search Console
Звіт Ефективність показує, як сайт представлений у результатах Google. Дані можна аналізувати за запитами, сторінками, країнами, пристроями, датами та типами результатів.
У верхній частині звіту доступні чотири основні показники:
- Кліки. Кількість переходів із результатів Google на сайт.
- Покази. Кількість появ сторінок сайту в результатах пошуку.
- Середній CTR. Частка показів, які завершилися переходом.
- Середня позиція. Середнє значення найвищої позиції результату сайту за кожним показом.
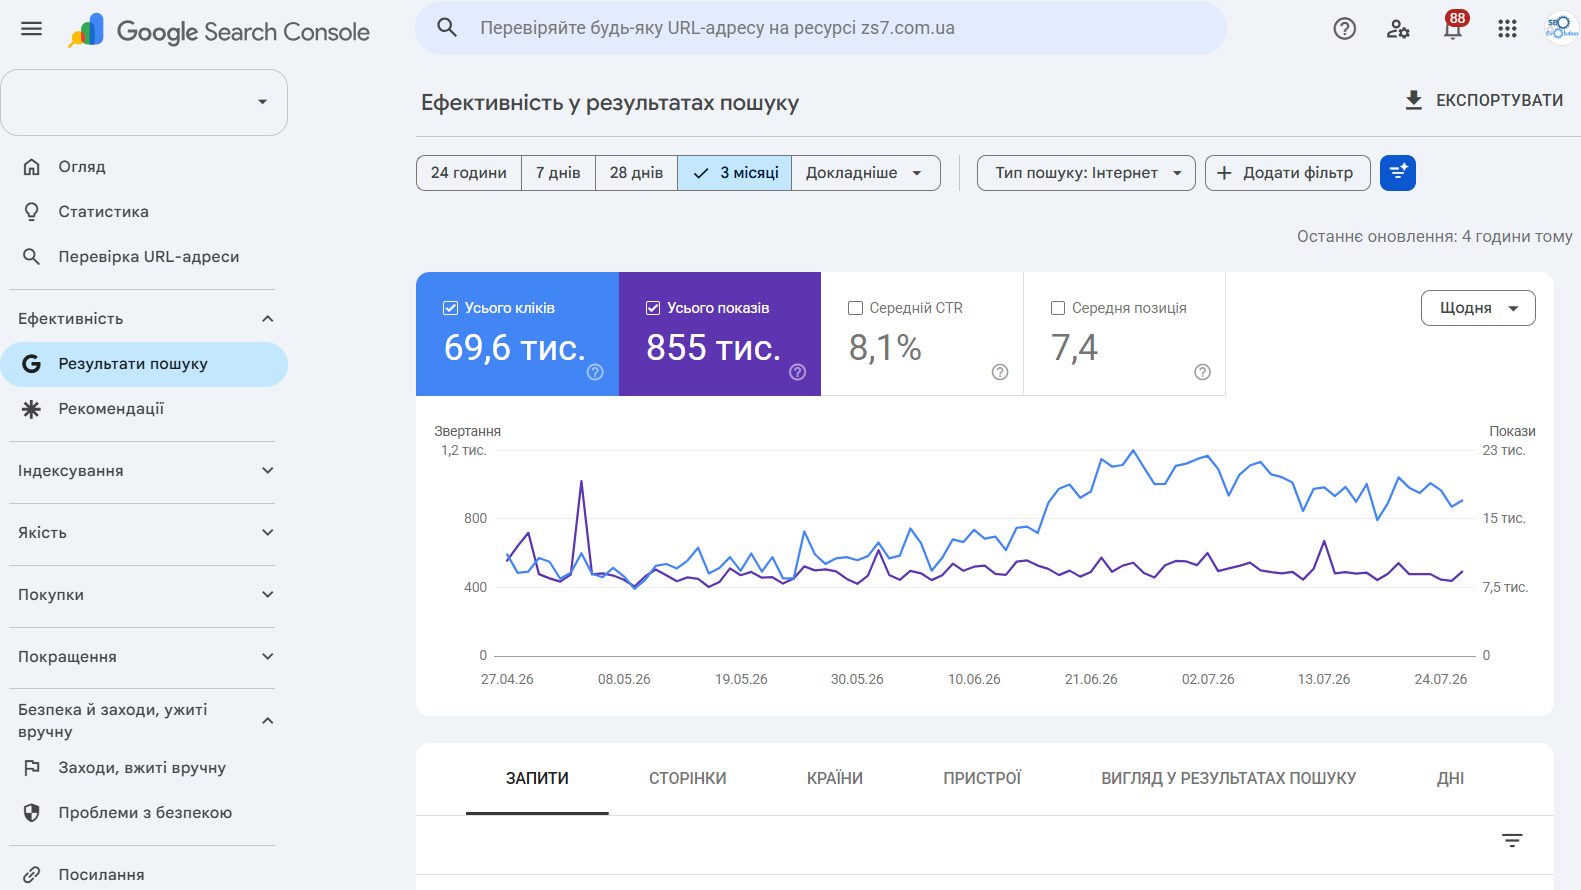
Search Console зберігає до 16 місяців історії. Для оперативної перевірки доступний період за останні 24 години з погодинною деталізацією. Тривалі проміжки можна переглядати за днями, тижнями або місяцями.
Як подивитися пошукові запити
- Відкрийте розділ Ефективність.
- Увімкніть кліки, покази, середній CTR і середню позицію.
- Виберіть період. Для сайту з невеликим трафіком почніть із трьох місяців.
- Перейдіть на вкладку Запити.
- Додайте фільтр за країною, пристроєм або сторінкою.
- Порівняйте дані з попереднім періодом або аналогічним періодом минулого року.
Щоб побачити, які URL показуються за конкретним запитом, натисніть на запит і відкрийте вкладку Сторінки. Якщо за одним запитом у різні дні показуються кілька схожих сторінок, перевірте, чи не конкурують вони між собою. Причиною можуть бути однаковий пошуковий намір, суперечливі канонічні теги або внутрішні посилання на різні версії сторінки.
Як знайти сторінки для зростання?
Почніть зі сторінок, які вже отримують покази. Google знає ці URL і пов’язує їх із пошуковими запитами, тому точкове доопрацювання може дати результат швидше за створення нового матеріалу.
- Багато показів і низький CTR. Перевірте Title, зміст першого екрана, відповідність запиту й фактичний вигляд сніпета.
- Запити на позиціях 5-20. Перевірте повноту відповіді, структуру сторінки, внутрішню перелінковку, зовнішні посилання та згадки про бренд.
- Покази ростуть швидше за кліки. Проаналізуйте CTR, зміни пошукової видачі та нових конкурентів.
- Кліки падають при стабільній позиції. Перевірте сезонність, зміну попиту й елементи видачі, які могли забрати частину переходів.
- Сторінка показується за нерелевантними запитами. Уточніть H1, підзаголовки, основну відповідь і тексти внутрішніх посилань.
Середня позиція підходить для аналізу тенденцій. Вона залежить від країни, пристрою, типу результату й конкретних показів. Для щоденного контролю фіксованого списку ключових слів використовуйте окремий сервіс моніторингу позицій.
У SEO-Evolution ми спочатку розділяємо дані за сторінкою, країною й пристроєм. Загальний графік може приховувати падіння окремої категорії або зростання, яке створили лише брендові запити.
Якщо покази впали разом із позицією за тими самими запитами, ми перевіряємо переоцінку релевантності сторінки та останні технічні зміни. Якщо позиція стабільна, а показів стало менше, аналізуємо попит, сезонність і зміни у складі пошукової видачі.
Як розділити брендові й небрендові запити
Брендові запити містять назву компанії, домену, продукту або характерні варіанти написання бренду. Небрендові запити описують товар, послугу чи проблему без згадки конкретної компанії.
У фільтрі Запит для частини ресурсів доступний готовий поділ на брендові та небрендові запити. Google не показує цей фільтр ресурсам із малою кількістю показів і ресурсам, створеним лише для окремого каталогу, наприклад https://example.com/blog/ .
Брендовий трафік показує сформований попит на компанію. Небрендовий допомагає оцінити, чи знаходять сайт люди, які ще не знають назву бренду.
Як об’єднати схожі запити одним фільтром
Регулярний вираз – це шаблон пошуку, який знаходить одразу кілька формулювань. Він потрібен, коли один бренд, товар або тема мають різні варіанти написання.
Наприклад, цей шаблон об’єднає чотири варіанти назви Search Console:
(google search console|search console|серч консоль|гугл серч консоль)Щоб застосувати його, додайте фільтр за запитом, виберіть режим регулярного виразу та вставте шаблон. У таблиці залишаться запити, що відповідають хоча б одному з указаних варіантів.
Для звичайного аналізу достатньо фільтрів Містить, Не містить і Точно відповідає. Регулярні вирази використовуйте для складніших груп запитів або URL-адрес.
Чому сума запитів менша за дані на графіку?
Загальний показник на графіку може бути більшим за суму рядків у таблиці Запити. Наприклад, графік показує 10 000 показів, а видимі запити в таблиці разом дають 9 300.
Різниця виникає з двох основних причин:
- Google приховує частину рідкісних запитів, щоб не розкривати дані окремих користувачів;
- інтерфейс показує лише найважливіші рядки, а не повний перелік усіх запитів.
Приховані запити входять до загального показника на графіку, але не відображаються окремими рядками. Після додавання фільтра за запитом Google також виключає їх із підсумку графіка, тому цифра може змінитися сильніше, ніж очікувалося.
На вкладці Сторінки більшість даних зараховується канонічній URL-адресі. Якщо користувач відкрив її альтернативну версію, клік може відображатися біля сторінки, яку Google вибрав основною.
Як зберігати дані великого сайту
Кнопка Експорт дозволяє завантажити поточний графік і таблицю у файл або Google Таблиці. Цього достатньо для разового аналізу невеликого сайту.
Для великого інтернет-магазину, медіа або міжнародного проєкту можна налаштувати щоденне передавання даних у Google BigQuery. Такий експорт допомагає:
- зберігати історію довше за стандартні 16 місяців;
- аналізувати великі масиви сторінок і запитів;
- об’єднувати дані кількох мовних версій або розділів;
- будувати власні звіти та інформаційні панелі.
BigQuery входить до Google Cloud. Зберігання та обробка великих обсягів даних можуть бути платними після використання безкоштовних квот.
Налаштування виконується через масовий експорт Search Console у BigQuery .
Індексація сторінок у Google Search Console
Звіт Індексування → Сторінки показує, які відомі Google URL-адреси потрапили до індексу та з яких причин інші сторінки були виключені.
Поза індексом нормально бачити сторінки з переспрямуванням, службові дублікати, альтернативні URL із правильно вказаною канонічною сторінкою та сторінки з тегом noindex. Перевірки потребують URL, які мають приносити трафік, але Google їх не індексує.
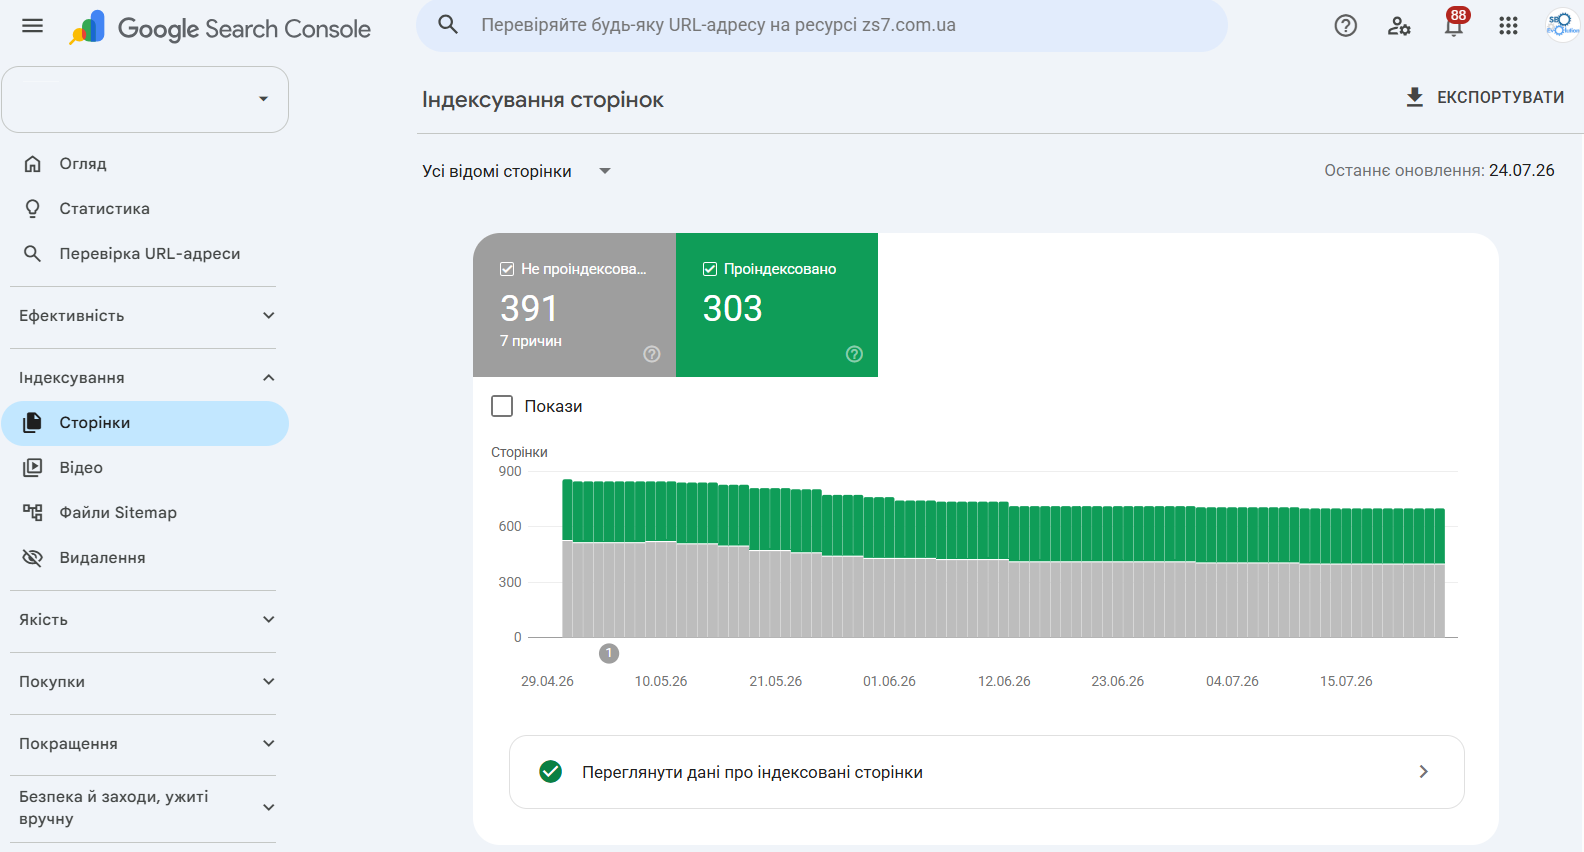
Основні статуси індексації
| Статус у Search Console | Що він означає | Що перевірити |
|---|---|---|
| Проскановано - наразі не проіндексовано | Google відкрив сторінку, але не включив її до індексу | Дублювання, зміст, канонічну URL-адресу й внутрішні посилання |
| Виявлено - наразі не проіндексовано | Google знайшов URL, але ще не просканував його | Кількість зайвих URL, навантаження сервера, sitemap і перелінковку |
| Копія. Система Google вибрала іншу канонічну сторінку, ніж користувач | Google вважає основною іншу версію сторінки | Канонічні теги, переспрямування, sitemap, контент і внутрішні посилання |
| Альтернативна сторінка з належним тегом канонічної сторінки | URL є копією, яка правильно посилається на основну версію | Якщо основна сторінка вибрана правильно, змін не потрібно |
| Виключено тегом noindex | На сторінці знайдено заборону індексації | Чи додано тег навмисно |
| Заблоковано файлом robots.txt | Googlebot не може просканувати URL | Правила Disallow і необхідність доступу до сторінки |
| Не знайдено (404) | Сервер повідомив, що сторінка відсутня | Чи URL справді видалений і чи немає на нього внутрішніх посилань |
| Програмна помилка 404 | Сторінка повертає код 200, але Google сприймає її як порожню або відсутню | Порожні категорії, сторінки видалених товарів, зміст і код відповіді |
| Сторінка з переспрямуванням | URL спрямовує користувача й Googlebot на іншу адресу | Якщо переспрямування заплановане й веде на правильну сторінку, змін не потрібно |
| Помилка переспрямування | Google не зміг пройти ланцюжок переспрямувань | Цикли, надто довгі ланцюжки, недоступну кінцеву адресу й помилки сервера |
| Помилка сервера (5xx) | Сервер не зміг віддати сторінку Googlebot | Логи, хостинг, тайм-аути, перевантаження й блокування роботів |
Як перевірити, чому сторінка не індексується?
Якщо важлива сторінка відсутня в індексі, перевірте її в такому порядку:
- URL-адреса повертає код 200 і відкривається без авторизації.
- У коді немає тега
noindex. - Googlebot не заблокований у файлі robots.txt.
- Канонічний тег указує на правильну основну версію сторінки.
- Канонічна URL-адреса присутня в sitemap.xml.
- На сторінку ведуть внутрішні посилання з проіндексованих розділів.
- Контент відповідає окремому пошуковому наміру й не дублює іншу сторінку.
Коли однаковий статус отримали сотні URL, перевірте їхній спільний шаблон. Причиною часто стає фільтр, параметр, помилка генерації канонічних тегів, некоректна карта сайту або зміна в CMS.
Search Console показує проблеми, які зафіксував Google. Повне сканування структури, серверних відповідей, дублів, переспрямувань і внутрішніх посилань проводиться в межах технічного аудиту сайту .
Перевірка URL-адреси
Інструмент Перевірка URL-адреси показує, що Google знає про конкретну сторінку. Через нього можна перевірити індексацію, доступність для сканування, канонічну версію, останній обхід і знайдені структуровані дані.
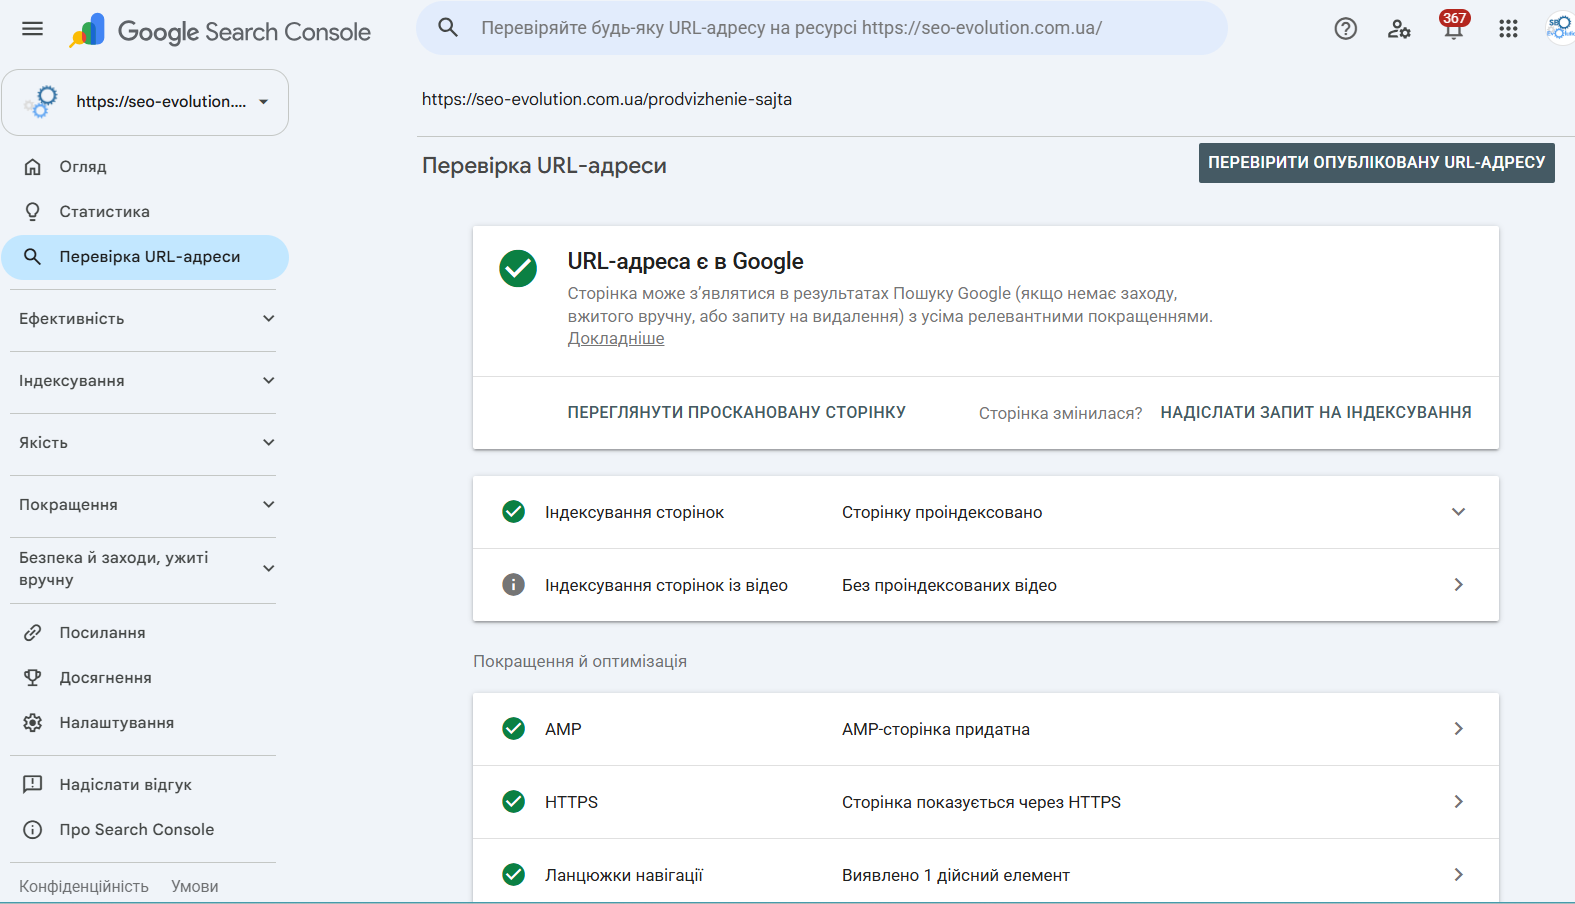
У звіті відображаються:
- статус URL-адреси в індексі;
- дата останнього сканування;
- тип сканувального робота Google;
- можливість сканування та індексації;
- канонічна сторінка, зазначена на сайті;
- канонічна сторінка, вибрана Google;
- знайдені структуровані дані;
- завантажені й заблоковані ресурси.
Перевірка опублікованої URL-адреси
Функція Перевірити опубліковану URL-адресу відкриває сторінку в момент запиту й показує, чи може Googlebot завантажити її поточну версію.
Ця перевірка потрібна після зміни тега noindex , robots.txt, канонічної URL-адреси, контенту або ресурсів сторінки. Вона показує поточний стан, а дані про проіндексовану версію оновляться після нового сканування Google.
Як надіслати запит на індексацію?
Після публікації важливої сторінки або виправлення технічної помилки натисніть Надіслати запит на індексацію. Google додасть URL до черги повторного сканування.
Перед надсиланням перевірте код відповіді, доступність для Googlebot, канонічну сторінку й відсутність тега noindex . Повторне натискання кнопки не виправить технічну помилку й не прискорить обхід.
Google самостійно визначає час повторного сканування й рішення про включення сторінки до індексу.
Sitemap і robots.txt у Search Console
XML-карта сайту допомагає Google знаходити потрібні сторінки, а robots.txt керує доступом робота до URL-адрес. Ці файли виконують різні задачі й не замінюють один одного.
Як додати sitemap у Google Search Console?
Sitemap.xml – це файл із переліком сторінок, які сайт рекомендує Google для сканування. Він найбільш корисний для великих каталогів, нових проєктів, багатомовних сайтів і сторінок із недостатньою внутрішньою перелінковкою.
- Перевірте, що файл відкривається за загальнодоступною URL-адресою.
- Відкрийте розділ Індексування → Файли Sitemap.
- Укажіть шлях, наприклад
sitemap.xmlабоsitemap_index.xml. - Надішліть карту й дочекайтеся результату обробки.
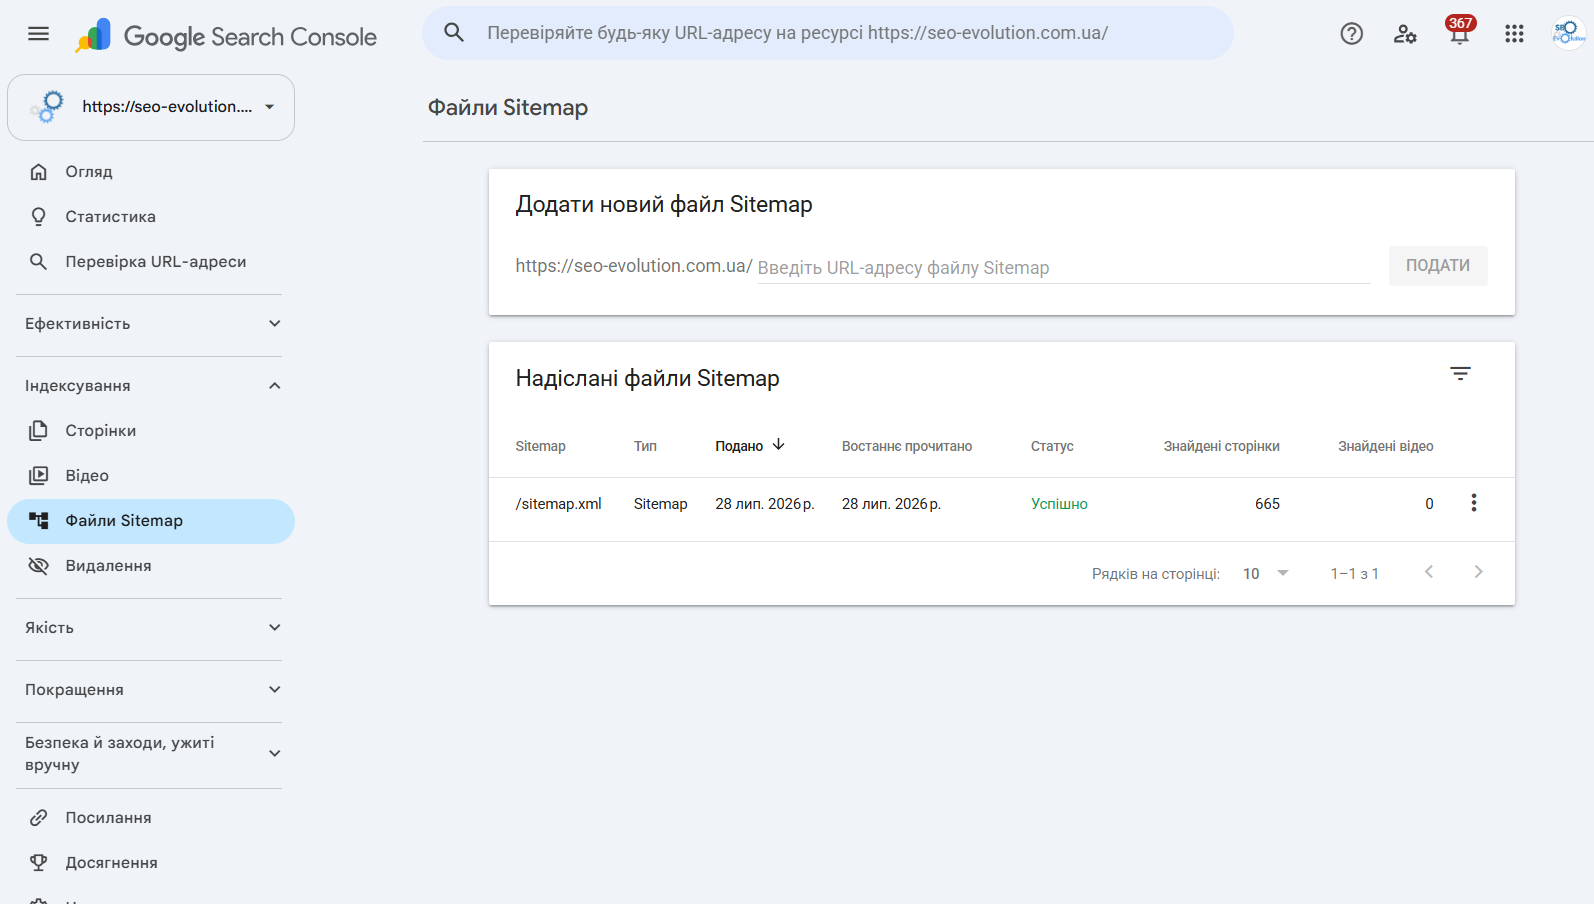
Статус Успішно означає, що Google отримав і прочитав файл. Він не підтверджує індексацію кожної сторінки з карти.
У sitemap додавайте канонічні URL-адреси, які повертають код 200 і мають потрапляти до пошуку. Не включайте сторінки з переспрямуванням, помилками 404, тегом noindex , службові дублікати й URL, заблоковані у robots.txt.
Як robots.txt впливає на індексацію
Файл robots.txt керує скануванням. Директива Disallow забороняє Googlebot відкривати URL, але сама по собі не видаляє сторінку з результатів пошуку.
Якщо сторінку потрібно прибрати з індексу, використовуйте тег noindex, код 404 або 410, авторизацію чи інший механізм відповідно до ситуації.
Не блокуйте URL у robots.txt до того, як Google побачить тег noindex. Інакше робот не зможе відкрити код сторінки та прочитати заборону індексації.
Основні веб-показники в Search Console
Звіт Якість → Основні веб-показники відображає реальний досвід користувачів за даними Звіту про взаємодію користувачів Chrome (Chrome UX Report). Сторінки об’єднуються в групи зі схожою структурою й поведінкою.
| Показник | Що він вимірює | Хороший результат |
|---|---|---|
| LCP | Час появи найбільшого видимого елемента | До 2,5 секунди |
| INP | Швидкість реакції сторінки на дію користувача | До 200 мілісекунд |
| CLS | Стабільність розташування елементів під час завантаження | До 0,1 |
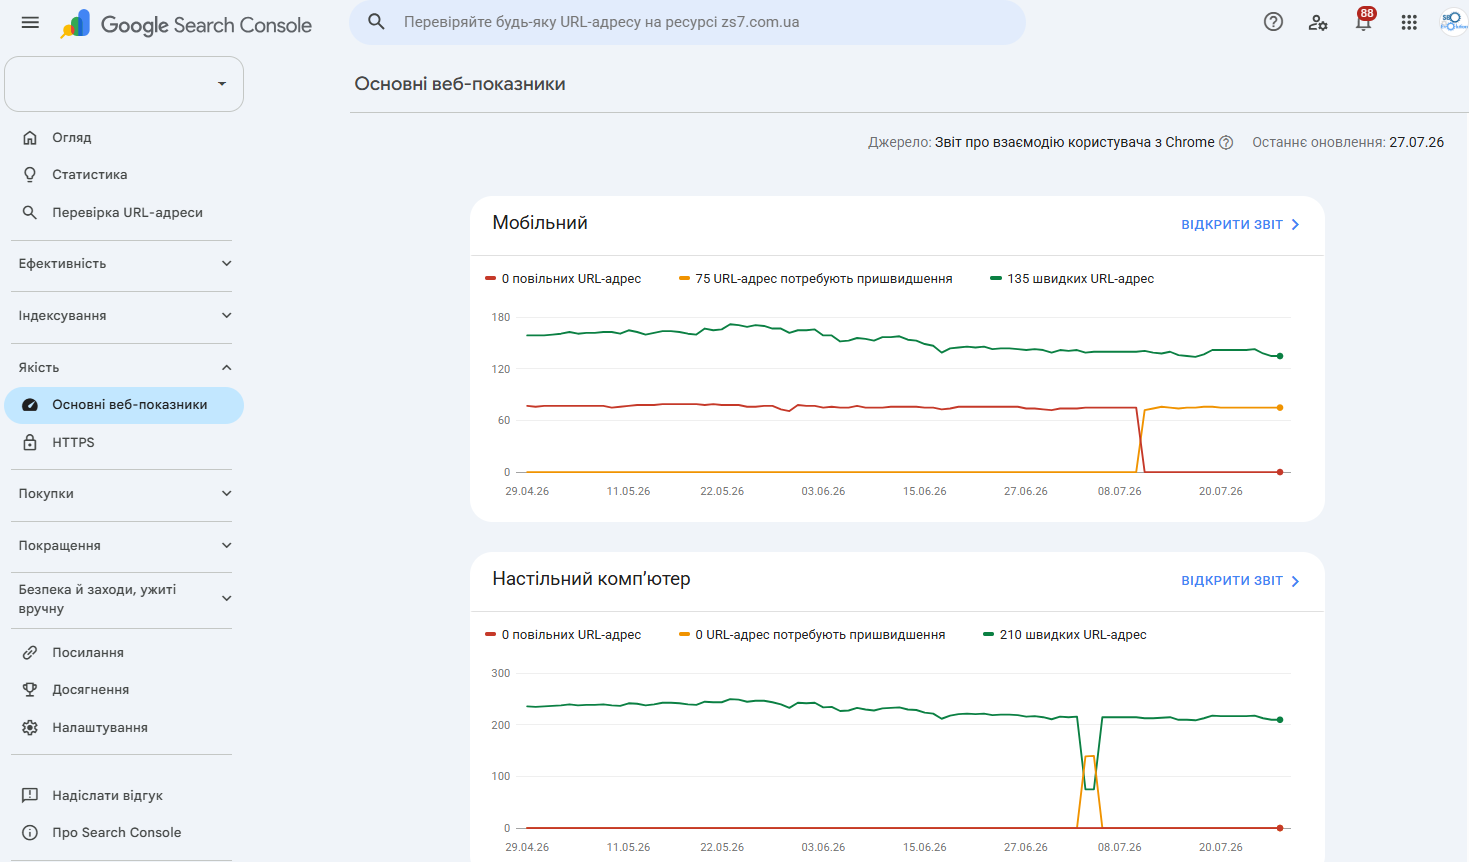
Google оцінює показники за 75-м процентилем. Це означає, що щонайменше 75% реальних відвідувань мають вкладатися в установлений поріг. Наприклад, хороший LCP отримує група, у якій не менше 75 із кожних 100 відвідувань завантажують найбільший елемент не довше ніж за 2,5 секунди.
Пороги LCP, INP і CLS можуть оновлюватися, тому під час аудиту звіряйте їх з актуальною документацією про Основні веб-показники .
Як знайти причину поганих показників
Відкрийте групу URL зі статусом Погано, виберіть типову сторінку й перевірте її у PageSpeed Insights та інструментах розробника Chrome.
Шукайте спільний елемент шаблону: банер, зображення першого екрана, сторонній сценарій, шрифт, CSS або повільну відповідь сервера.
Якщо поганий LCP мають усі категорії інтернет-магазину, виправлення однієї сторінки не змінить стан групи. Потрібно оптимізувати шаблон категорії.
Основні веб-показники характеризують швидкість і стабільність сторінок. Позиції також залежать від змісту, релевантності, структури та інших сигналів Google.
HTTPS, структуровані дані та сканування
Окремі технічні звіти Search Console допомагають перевірити захищені версії сторінок, структуровані дані та активність Googlebot. Вони доповнюють звіти індексації, але не замінюють перевірку коду й сервера.
Звіт HTTPS
Звіт HTTPS показує сторінки, для яких Google не зміг використати захищену версію. Після переходу з HTTP перевірте сертифікат, переспрямування, канонічні URL-адреси, sitemap і внутрішні посилання.
Звіти структурованих даних
У розділі Покращення можуть з’являтися звіти для навігаційних ланцюжків, товарів, відео, рецептів, вакансій та інших підтримуваних типів розмітки.
Помилка означає, що конкретний елемент не відповідає вимогам розширеного результату. Сама сторінка при цьому може залишатися проіндексованою та показуватися як звичайний результат.
Статистика сканування
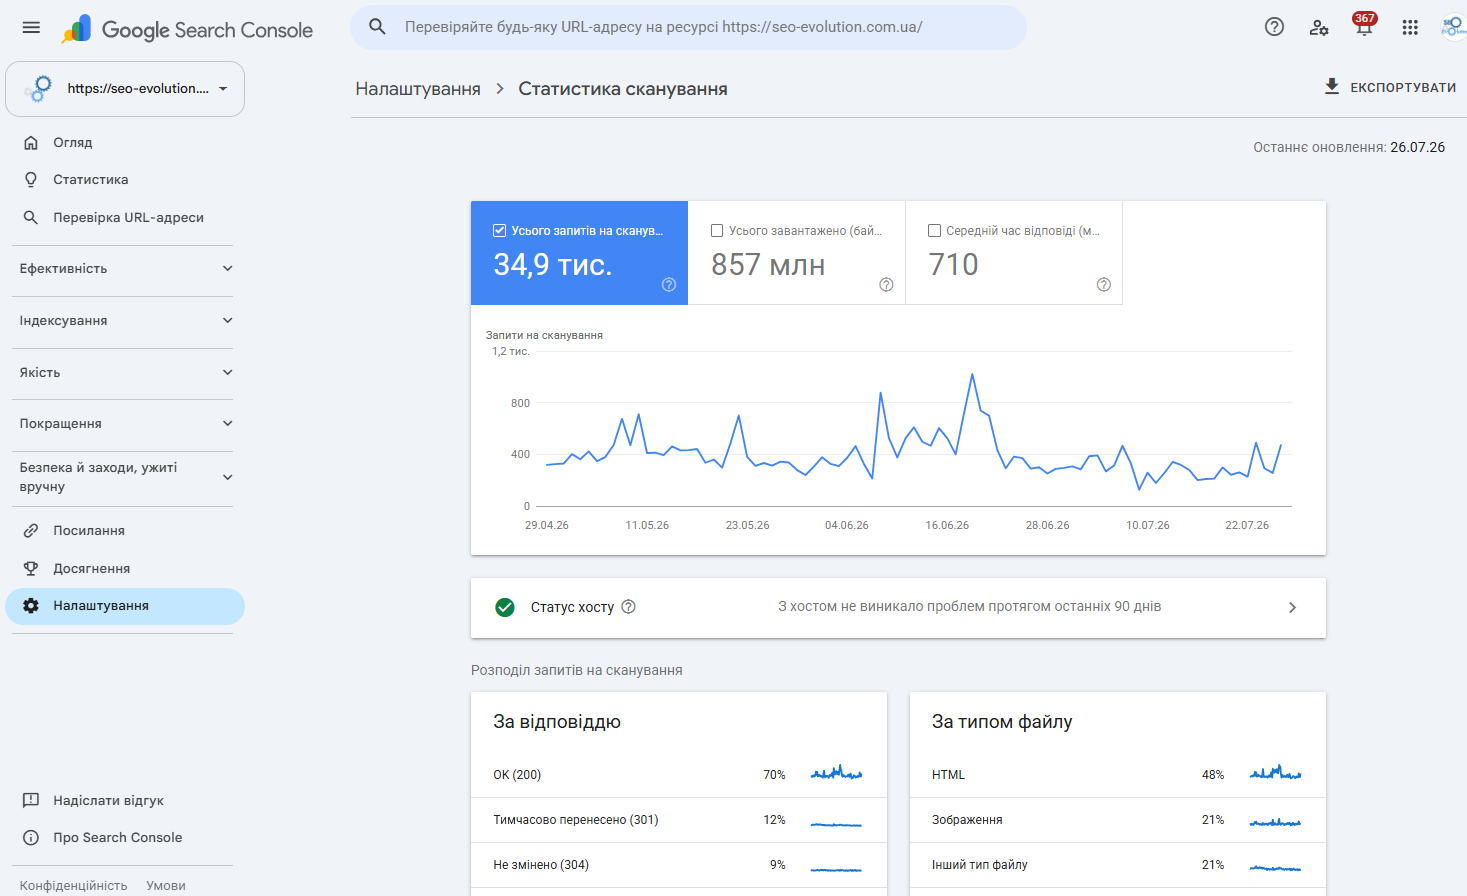
Звіт знаходиться за шляхом Налаштування → Статистика сканування. Він показує кількість запитів Googlebot, відповіді сервера, час завантаження, типи файлів і доступність хоста.
Для невеликого сайту достатньо контролювати помилки індексації та окремі URL. Статистика сканування потрібна насамперед великим каталогам, маркетплейсам і медіа з тисячами сторінок.
У звіті можна знайти:
- різке зростання сканування параметричних URL;
- збільшення відповідей сервера 5xx;
- зниження активності Googlebot після технічної зміни;
- проблеми доступності DNS, сервера або robots.txt;
- надмірне сканування непотрібних типів файлів.
Безпека й заходи, вжиті вручну
Цей розділ потрібно перевірити після різкого падіння видимості, попередження в браузері або появи сторонніх сторінок на сайті. Він містить два окремі звіти: заходи Google через порушення правил і технічні проблеми безпеки.
Заходи, вжиті вручну
Звіт показує санкції, які співробітник Google застосував після виявлення порушення антиспам-політик. Обмеження може стосуватися окремих сторінок, розділу або всього сайту.
Якщо захід активний:
- відкрийте опис порушення;
- визначте уражені сторінки або шаблони;
- усуньте причину на всьому сайті;
- підготуйте запит на повторний розгляд;
- опишіть виконані зміни конкретно й без загальних обіцянок.
Відсутність повідомлення означає, що Google не застосував ручний захід. Алгоритмічні зміни пошуку в цьому звіті не відображаються.
Проблеми з безпекою
Звіт повідомляє про злам, фішинг, шкідливе програмне забезпечення, небезпечні завантаження та сторонній контент, який може нашкодити відвідувачам.
Після такого повідомлення змініть доступи, закрийте вразливість, очистьте заражені файли, перевірте базу даних і всі знайдені URL. Видалення видимого спаму без усунення способу проникнення дасть лише тимчасовий результат.
Як видалити URL із пошуку Google?
Інструмент Видалення допомагає швидко приховати URL-адресу з результатів Google приблизно на шість місяців або очистити застарілий фрагмент сторінки до повторного сканування.
Знайти його можна в розділі Індексування → Видалення. Після тимчасового приховування потрібно закріпити результат на самому сайті:
- повернути код 404 або 410 для сторінки, якої більше немає;
- налаштувати 301-переспрямування, якщо існує пряма заміна;
- додати тег
noindex, якщо сторінка потрібна користувачам, але не пошуку; - закрити конфіденційний контент авторизацією.
Інструмент Видалення приховує результат тимчасово. Якщо URL продовжує повертати код 200 і залишається відкритим для індексації, він може знову з’явитися в Google.
Посилання в Google Search Console
Звіт Посилання дає базову картину зовнішніх і внутрішніх зв’язків сайту. Він допомагає перевірити, які сторінки отримують найбільше посилань і як внутрішня структура розподіляє вагу між розділами.
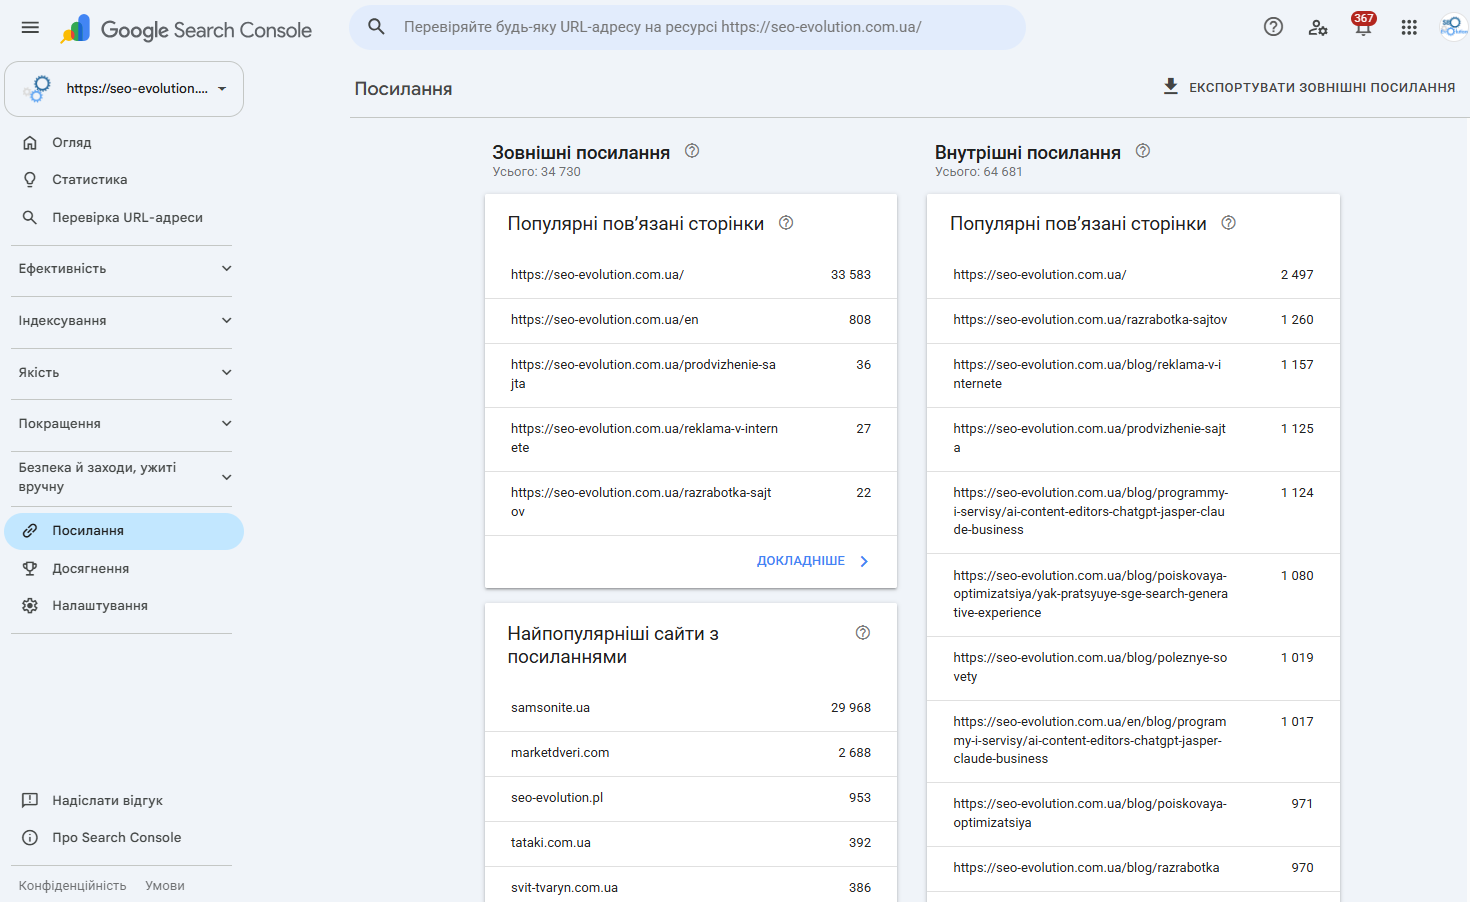
У звіті можна побачити:
- сторінки, на які найчастіше посилаються інші сайти;
- домени, що ведуть на сайт;
- тексти зовнішніх посилань;
- сторінки з найбільшою кількістю внутрішніх посилань.
Google показує вибірку відомих посилань, тому звіт не є повним переліком усього посилального профілю. Для детального аналізу доповніть його даними інших сервісів і перевіркою сторінок-донорів.
У внутрішній частині звіту знайдіть важливі сторінки, на які майже не ведуть посилання з сайту. Часто це старі статті, нові послуги, глибокі категорії або сторінки, додані поза основною навігацією.
Статистика та нові функції Search Console
Розділ Статистика збирає на одному екрані сторінки й запити з найбільшим зростанням або падінням. Окремо Google поступово впроваджує групування запитів, примітки на графіках, налаштування звітів за текстовим описом і дані про генеративний пошук.
Що показує розділ Статистика
Статистика містить короткий огляд кліків і показів, популярних сторінок, контенту зі зростанням або падінням та основних пошукових запитів.
Звіт допомагає швидко побачити:
- які нові сторінки почали отримувати трафік;
- які матеріали втратили кліки;
- які теми набирають попит;
- які запити змінилися найбільше;
- які зовнішні джерела Google приводять користувачів на сайт.
Запити, які ведуть на ваш сайт
У цій картці Google може об’єднувати близькі за змістом пошукові формулювання в тематичні групи. Наприклад, запити як налаштувати Search Console, налаштування Search Console і підключення Search Console можуть потрапити до однієї теми.
Натисніть на групу, щоб перейти до звіту Ефективність і переглянути окремі запити, сторінки та показники. Групування доступне ресурсам, для яких Google має достатньо даних.
Як позначити оновлення сайту на графіку
У звіті Ефективність можна додати власну примітку до конкретної дати. Натисніть правою кнопкою миші на графіку, виберіть Додати примітку та коротко опишіть подію.
Зафіксуйте запуск нового дизайну, зміну CMS, перенесення домену, оновлення великого розділу або технічне виправлення. Довжина примітки обмежена 120 символами, а бачать її всі користувачі з доступом до ресурсу.
Через кілька місяців така позначка допоможе співвіднести зміну кліків і показів із конкретним оновленням.
Як налаштувати звіт текстовим запитом
Google тестує функцію налаштування звіту Ефективність за допомогою ШІ на невеликій частині акаунтів. Якщо вона доступна, опишіть потрібний зріз звичайним реченням, наприклад: покажи кліки мобільних користувачів на сторінки блогу за останні три місяці.
Система може самостійно:
- додати фільтри за запитом, сторінкою, країною або пристроєм;
- вибрати період;
- налаштувати порівняння;
- увімкнути потрібні показники.
Функція не сортує таблицю й не вивантажує дані. Перед аналізом перевірте, чи правильно система зрозуміла запит і налаштувала фільтри. Google поки не опублікував окремий перелік підтримуваних мов.
Звіт генеративного пошуку
Станом на липень 2026 року Google поступово тестує окремий Звіт про ефективність генеративного ШІ в Пошуку. Він показує органічні покази посилань на сайт в Оглядах від ШІ та Режимі ШІ.
У звіті можна аналізувати:
- динаміку показів за днями, тижнями або місяцями;
- сторінки, які найчастіше з’являються в генеративних відповідях;
- країни, з яких надходять покази;
- типи пристроїв.
Google не публікує окремий список країн, у яких доступний саме звіт Search Console. Він розгортається для частини ресурсів і може не відображатися через обмежений етап тестування або недостатню кількість показів.
Огляди від ШІ та Режим ШІ вже доступні користувачам в Україні й підтримують українську мову. Тому українські сайти можуть отримувати покази в цих функціях, але окремий звіт з’явиться лише після надання доступу конкретному ресурсу та накопичення достатньої кількості даних.
Керування участю сайту в генеративному пошуку
На частині ресурсів у розділі Налаштування з’явився параметр Функції на основі генеративного ШІ в Пошуку. Через нього власник визначає, чи можуть посилання й контент сайту використовуватися в Оглядах від ШІ, Режимі ШІ та підтримуваних генеративних функціях Google Discover.
За замовчуванням участь дозволена. Якщо власник заборонить її, посилання на сайт і його контент не показуватимуться в цих генеративних функціях, а ресурс не отримуватиме з них показів і переходів.
Цей параметр не впливає на звичайні результати Google, не є сигналом ранжування та не керує навчанням моделей. Він також не змінює присутність сайту в ChatGPT, Microsoft Copilot, Perplexity або окремому застосунку Gemini.
Перед вимкненням ознайомтеся з правилами Google : заборона прибере сайт із підтримуваних генеративних функцій, але не зі звичайних результатів пошуку.
Search Console охоплює лише генеративні функції Google. Для відстеження згадок у ChatGPT, Gemini, Microsoft Copilot і Perplexity потрібен окремий моніторинг у межах GEO-просування: перевірка відповідей, робота із сутностями, контентом, репутаційними джерелами й зовнішніми згадками.
Як зв’язати Search Console з GA4
Зв’язка Search Console з Google Analytics 4 дозволяє переглядати дані GSC і показники поведінки GA4 в одному середовищі. GSC показує запити, покази, кліки й позиції, а GA4 – перегляди, залучення, події, конверсії та дохід.
Після підключення в Google Analytics 4 доступні два звіти:
- Запити. Показує пошукові запити та основні показники Search Console.
- Трафік звичайного пошуку Google. Поєднує дані посадкових сторінок із поведінкою користувачів після переходу.
Для створення зв’язку потрібні права підтвердженого власника Search Console й роль Редактор у Google Analytics 4.
Цифри двох систем не повинні збігатися повністю. Search Console рахує кліки в пошуку, а GA4 фіксує сеанси після завантаження сторінки. На різницю також впливають згода на файли cookie, блокувальники, часові пояси, канонічні URL-адреси й правила атрибуції. Зв’язка не дозволяє пов’язати окремий пошуковий запит із діями конкретного користувача на сайті.
Налаштування Google Analytics, Tag Manager, подій і перевірка коректності збору даних входять до послуги підключення та налаштування Google Analytics 4 (GA4) .
Як часто перевіряти Google Search Console
Частота перевірки залежить від розміру сайту, кількості нових сторінок і темпу технічних змін. Невеликому корпоративному сайту достатньо щомісячного аналізу, а великий магазин або медіа потребують регулярнішого контролю.
- Після публікації важливої сторінки. Перевірте URL-адресу, канонічну версію, доступність і наявність у sitemap.
- Після релізу або міграції. Перегляньте помилки 404, переспрямування, індексацію, sitemap, robots.txt і динаміку кліків.
- Щотижня. Перевірте різкі зміни трафіку, нові проблеми індексації та повідомлення Google.
- Щомісяця. Проаналізуйте запити, сторінки зі зростанням, CTR, Основні веб-показники та внутрішні посилання.
- Щокварталу. Оцініть довгі тренди, матеріали зі спадом, структуру сайту й наступні SEO-пріоритети.
Після значної зміни додайте примітку на графік. Вона допоможе відрізнити наслідки оновлення сайту від сезонності, змін попиту або оновлення пошукових систем.
Як використовувати дані GSC для SEO
Дані Search Console мають приводити до конкретної перевірки й дії.
- За низького CTR порівняйте запити, сніпет, пошуковий намір і результати конкурентів.
- Для статусу Проскановано - наразі не проіндексовано перевірте зміст сторінки, дублікати, канонічну URL-адресу й внутрішні посилання.
- Після падіння трафіку через реліз перегляньте переспрямування, коди відповіді, sitemap, robots.txt та індексацію основних шаблонів.
- Погані Основні веб-показники аналізуйте на рівні спільного шаблону, а не одного випадкового URL.
- Зростання небрендових показів означає, що сайт почав охоплювати нові пошукові теми й аудиторію.
Не оцінюйте сайт лише за одним показником. Зростання середньої позиції без кліків може не дати бізнесу результату, а збільшення трафіку без заявок може вказувати на нерелевантні запити або слабкі посадкові сторінки.
У роботі SEO-Evolution дані Search Console поєднуються з технічним аудитом, аналітикою, дослідженням конкурентів, контентом і комерційними задачами сайту. Такий підхід входить до SEO-просування сайту та допомагає визначати порядок робіт за реальними даними.